In today’s rapidly evolving financial markets, traders and investors require robust, versatile tools to analyze data, develop strategies, and execute trades efficiently. One platform that has gained immense popularity for its comprehensive features and user-friendly interface is trading view. Renowned for its advanced charting capabilities, social trading community, and seamless platform integrations, TradingView stands out as a vital resource for both novice traders and seasoned professionals. This extensive guide explores how to leverage TradingView’s full potential to optimize market analysis and refine trading strategies.
Understanding Trading View: Features and Benefits
Core tools and charting capabilities
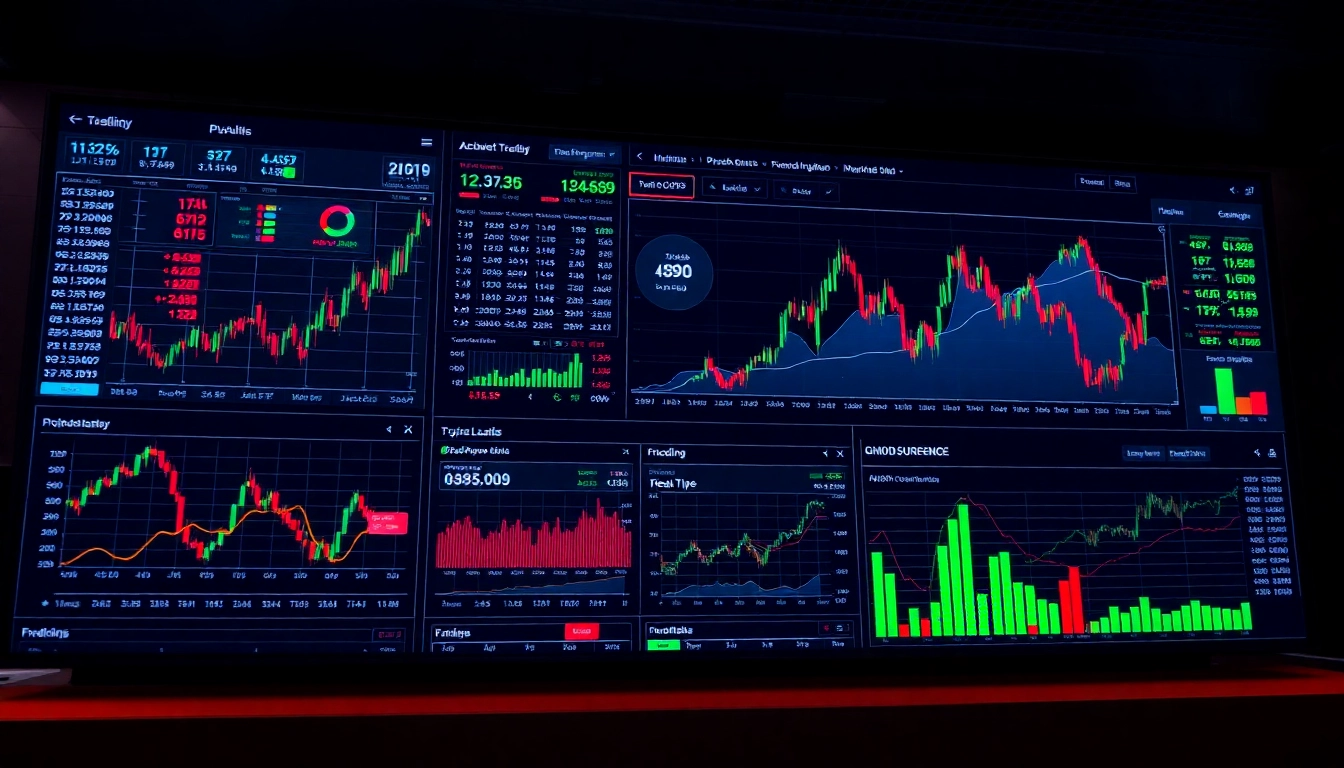
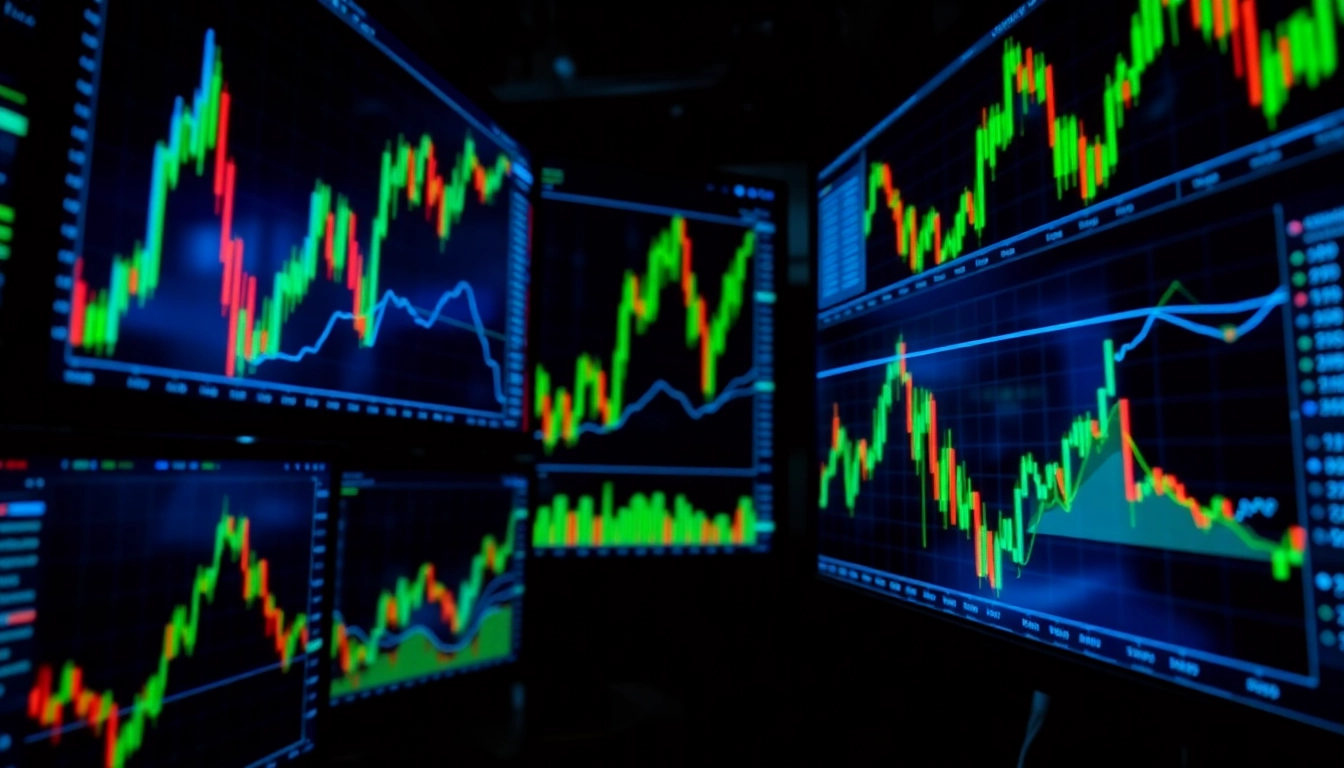
At the heart of TradingView’s dominance in the trading community is its powerful suite of charting tools. The platform offers a wide array of customizable charts, including candlestick, bar, line, and area charts, allowing traders to visualize market data in the most insightful way. Advanced features like multiple timeframes enable traders to analyze trends over short or long periods, fostering a multi-dimensional understanding of market movements.
One of TradingView’s standout capabilities is its extensive library of technical indicators. Users can access over 100 built-in indicators—such as Moving Averages, Relative Strength Index (RSI), Bollinger Bands, Fibonacci retracement, and Ichimoku Clouds—which can be layered and combined for nuanced analysis. Moreover, traders can create custom indicators using Pine Script, TradingView’s proprietary scripting language, allowing for personalized strategies and unique analysis methods.
Drawing tools further enhance analytical flexibility. Traders can mark support and resistance zones, trend lines, channels, and geometric shapes to identify key levels and patterns visually. These tools aid in recognizing chart formations like head and shoulders, double tops/bottoms, flags, and pennants, which are crucial for timing entries and exits.
Social trading and community insights
TradingView transcends traditional charting platforms by integrating a vibrant social network. Users can publish ideas, share insights, and discuss market conditions in real-time alongside a global community of traders and investors. This collaborative environment fosters peer-to-peer learning, enhances market understanding, and introduces fresh perspectives through community-generated ideas.
Community features include comment sections, idea ratings, and discussion forums, enabling traders to validate strategies or challenge prevailing assumptions. The ‘Ideas’ section showcases trending trade setups, which can serve as inspiration or validation for individual strategies. Additionally, traders can follow influential analysts whose ideas and commentary shape market sentiment.
This community-driven component not only democratizes market analysis but also offers educational value, especially for new traders seeking to learn from experienced peers. The real-time sharing of analysis ensures that traders stay updated on market shifts and sentiment changes.
Platforms and device integrations
TradingView is available across a variety of devices and platforms, ensuring traders can stay connected wherever they are. The web-based version, accessible through browsers, provides full feature access with minimal setup. For those who prefer mobile trading, TradingView offers native apps on Android and iOS, enabling on-the-go monitoring of markets, alerts, and chart updates.
Additionally, TradingView integrates seamlessly with major brokerage platforms, allowing traders to execute orders directly from charts. This integration minimizes latency and streamlines the trading process, positioning TradingView as both a charting and order entry tool. Desktop versions and extensions further provide enhanced performance for active traders and institutions looking for stability and speed.
How to Use Trading View Effectively for Market Analysis
Setting up custom watchlists and alerts
Creating tailored watchlists is fundamental to active market monitoring. TradingView allows users to compile lists of stocks, cryptocurrencies, forex pairs, or indices, organized based on sectors, strategies, or personal preferences. This enables quick access to relevant markets without cluttering the workspace.
Alerts are vital for timely decision-making. Users can set price alerts, indicator alerts, or drawing-based triggers. For example, you might set an alert for when Bitcoin crosses a key support level or when RSI reaches an overbought state. Alerts can be delivered via email, SMS, or push notifications, ensuring no opportunity is missed.
Applying technical indicators and drawing tools
Maximizing TradingView’s charting power involves adept use of indicators and drawing tools. A typical approach combines trend-following indicators like Moving Averages with oscillators such as RSI or MACD to identify momentum and overbought/oversold conditions. For instance, combining the 50-day and 200-day Simple Moving Averages can signal trend reversals or confirmations.
Drawing tools help visualize key levels, trendlines, and patterns. Marking Fibonacci retracement levels during a correction offers potential support zones, while trendlines can indicate breakout points. Use these tools in conjunction with indicator signals for high-probability trade setups.
Interpreting chart patterns for entry and exit points
Recognizing chart patterns is pivotal for timing entries and exits. Patterns like head and shoulders, double tops/bottoms, triangles, and flags are foundations of technical analysis. For example, a breakout from a symmetrical triangle pattern often indicates a significant move, presenting a strategic entry point.
Combine pattern recognition with volume analysis and indicator confirmation for robust trades. Always consider the broader market context and risk management principles, such as setting stop-losses at logical levels derived from pattern boundaries.
Integrating Trading View into Your Trading Strategy
Combining technical analysis with fundamental data
While TradingView excels at technical analysis, integrating fundamental data enhances decision-making. Traders can overlay news sentiment and economic calendars within the platform, or utilize external data feeds to corroborate technical signals.
For example, a bullish technical setup on a stock coinciding with positive earnings reports or macroeconomic developments might support a stronger conviction in entering a position.
Automating alerts and signals for timely decisions
Automation is key for proactive trading. Using TradingView’s alert system, traders can automatically trigger actions when predefined conditions are met, such as price breakouts or indicator crossovers. These alerts can be integrated with third-party trading bots or platforms via Webhook, enabling semi-automated or fully automated trading strategies.
Additionally, backtesting strategies within TradingView helps identify the historical effectiveness of signals, refining parameters for future trades.
Tracking your performance and refining your approach
Consistent evaluation is essential for improvement. TradingView’s paper trading feature allows testing strategies without risking real capital. Traders should regularly analyze their trades’ win/loss ratios, risk-reward profiles, and adherence to their setups.
Adjust strategies based on performance metrics, market changes, and new insights gained from community ideas or academic research. Continuous learning and adaptation are the hallmarks of successful trading.
Advanced Techniques for Experienced Traders
Using scripting and custom indicators
For seasoned traders, Pine Script provides the ability to develop custom indicators and automated strategies. Crafting personalized signals or combining multiple indicators can give a competitive edge. For example, creating a custom oscillator that detects divergence patterns can alert to potential reversals before conventional indicators do.
Collaborating with community ideas and ideas sharing
Harness the collective intelligence of the TradingView community by actively participating in idea sharing. Analyzing popular ideas can reveal institutional biases or emerging trends. Traders can modify or duplicate community scripts to tailor to their specific needs or test shared strategies through backtesting tools.
Backtesting strategies within Trading View
Backtesting allows traders to evaluate the historical performance of strategies over various market conditions. TradingView offers a straightforward backtesting interface where traders can simulate trades based on predefined rules, helping optimize parameters and risk management techniques before deploying live capital.
Future Trends and Improvements in Trading View
Emerging features and updates on the platform
TradingView continues to evolve, with upcoming features such as enhanced AI-driven insights, improved user interface, and expanded indicator libraries. The platform is also likely to introduce more collaboration tools to facilitate live trading room experiences and mentorship programs.
Integration with other trading tools and APIs
Future developments may include deeper integration with brokerage APIs, automated trading systems, and data services. Such connectivity can streamline workflows, reduce latency, and allow traders to build comprehensive ecosystem solutions tailored to their needs.
Leveraging AI and machine learning for smarter analysis
Artificial intelligence and machine learning algorithms are poised to revolutionize market analysis. TradingView is exploring AI-powered predictions, pattern recognition, and sentiment analysis features that can enhance decision-making accuracy and trading efficiency.